 killdate.dev
4 minute read
The problem
Deep into building Shelf, I realised I was holding a mental model of the app that was partially wrong. Not catastrophically wrong — the app was working — but wrong in the way a hand-drawn map is wrong. Good enough to navigate. Not accurate enough to trust for anything precise.
I couldn’t find a tool that showed me the app clearly. So we built one.
Why it compounds
Remix’s file-based router encodes hierarchy in filenames. The convention is elegant. The cognitive overhead of holding forty files in that naming convention is real.
Each route file does three jobs: a loader for server-side data fetching, an action for mutations, and a default export for the component. Routes nest inside each other through <Outlet /> — the component tree at any URL is a stack of nested layouts, none of it visible from the file tree.
Those three layers compound. But there’s a fourth: AI-assisted builds add their own incomplete map on top of yours. If your mental model is partially wrong, the briefs you write will be partially wrong, and the code that comes back will reflect that. We caught several of these after the fact — a loader dependency assumed, an outlet chain misread, a data fetch landing in the wrong route.
The map problem isn’t just cognitive overhead. It’s a drift multiplier.
What we built
Three iterations, each one answering a question the previous one couldn’t.
v1: Route tree with badges. Colour-coded badges marking which routes had loaders (L), actions (A), and components (UI). Right panel showed the outlet chain from root to leaf. Useful immediately — it made obvious we were fetching more data than several components needed.
v2: URL-first with nested containment. The containment view was the breakthrough. Seeing _app wrapping dashboard wrapping _index as literal nested boxes made the layout architecture immediately readable. What the file naming implies, the diagram makes explicit.
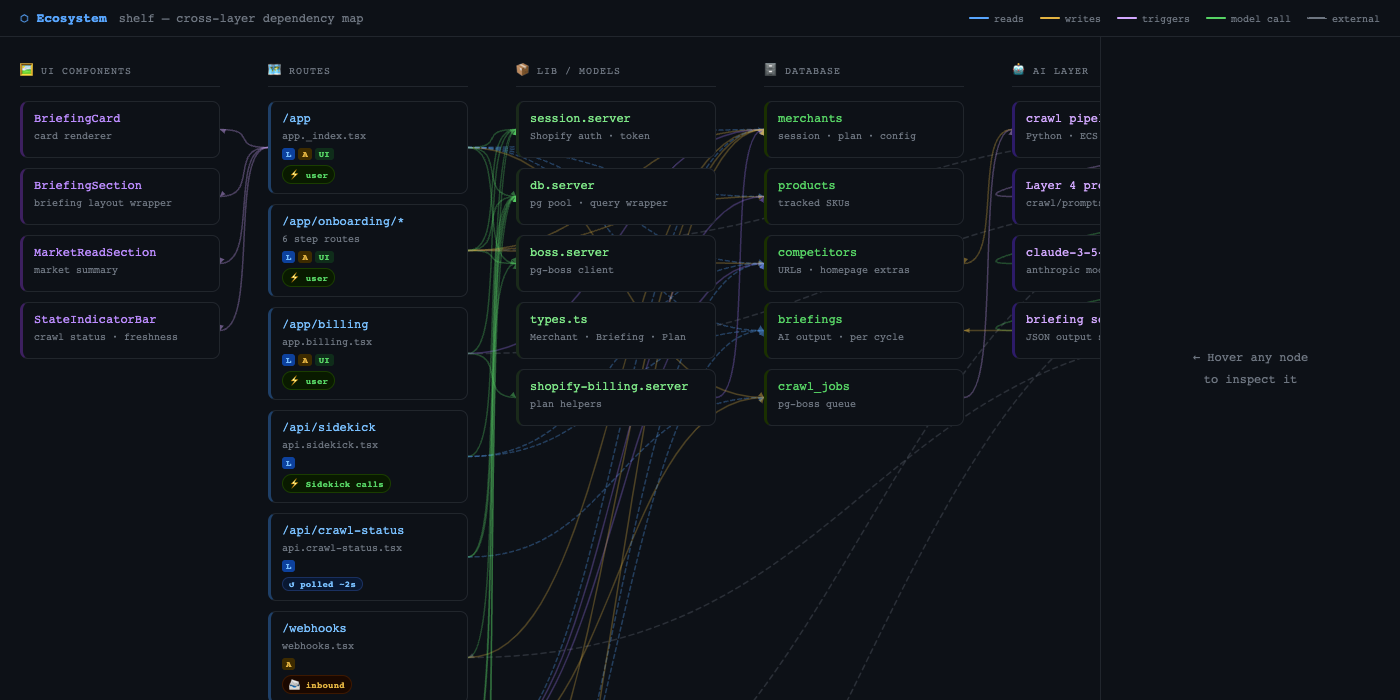
v3: Ecosystem map. A cross-layer view: routes, database tables, the AI layer, external APIs. Edges colour-coded by type. Hover a node and everything unconnected dims.
The answer for Shelf: the AI layer is almost entirely decoupled from the Remix app. Claude runs inside ECS tasks, not route loaders. The ecosystem map made that visible in a way no amount of code reading had.
How the parsing works
The route tree is simpler than it looks. Filter app/routes/, parse dot-notation for parent-child relationships, check each file for loader, action, and export default to badge the route. Fully automatable across any Remix app.
The ecosystem map is different. Route-to-database edges require reading the code. For the prototype we mapped it manually — fifteen minutes, more accurate than any static analysis because we know what the code does. For a general tool you’d need static analysis (grep for db.query, prisma.model) or a config file.
What a small-team solution looks like
The tool is a static HTML file — no build step, no backend, no framework. Open it in a browser. It works.
Don’t wait for the tool that would work for anyone. Build the tool that works for you, now. If it generalises, open-source it later.
vizstack
We shipped it as vizstack — an open-source CLI that runs against any Remix or Next.js App Router codebase and produces a single self-contained HTML file.
node parse.js ./your-app viz.html
open viz.html
No install, no server, no dependencies. Works on Epic Stack (23 routes, 3 tables) or Inbox Zero (253 routes, 49 tables, 4 AI providers). Trigger detection — webhooks, scheduled crons, polling endpoints — works zero-config from URL patterns.
One known limitation: Prisma gives full table schemas. Raw SQL drivers collapse to a single DB node.
What we added: click-to-pin and a chat panel
Two things that changed how we actually use it day-to-day.
Click-to-pin. Hovering was too ephemeral — move your mouse and everything clears. Now clicking a node locks it. Blue ring, edges stay highlighted, info panel stays open. Hover still works for previewing other nodes; mousing away snaps back to the pin. Click background to release.
Architecture-aware chat. The ecosystem map already has all the data — every node, every edge, every file path — as JavaScript in the page. We wired that directly into a Claude system prompt and added a chat panel. Pin a node, switch to the Chat tab, ask a question. Claude already knows the full graph before you type anything.
“What breaks first if the crawl pipeline silently fails?”
It answers by reasoning through crawl_jobs → briefings → StateIndicatorBar polling — because it knows those connections from the map itself. Not from docs. Not from code reading. From the graph.
The plumbing: a small AWS Lambda proxies requests to the Anthropic API (CORS blocks direct browser calls). The system prompt is built dynamically from NODE_DATA and EDGES at call time, with the pinned node’s connections injected as focused context.
The chat is personal — the architecture map is the shareable part.