 killdate.dev
2 minute read
Post 18 covers the origin. This picks up where it left off.
The thing we shipped was useful. The thing we found ourselves wanting was different: we wanted to ask questions about the map.
What 2.0 adds
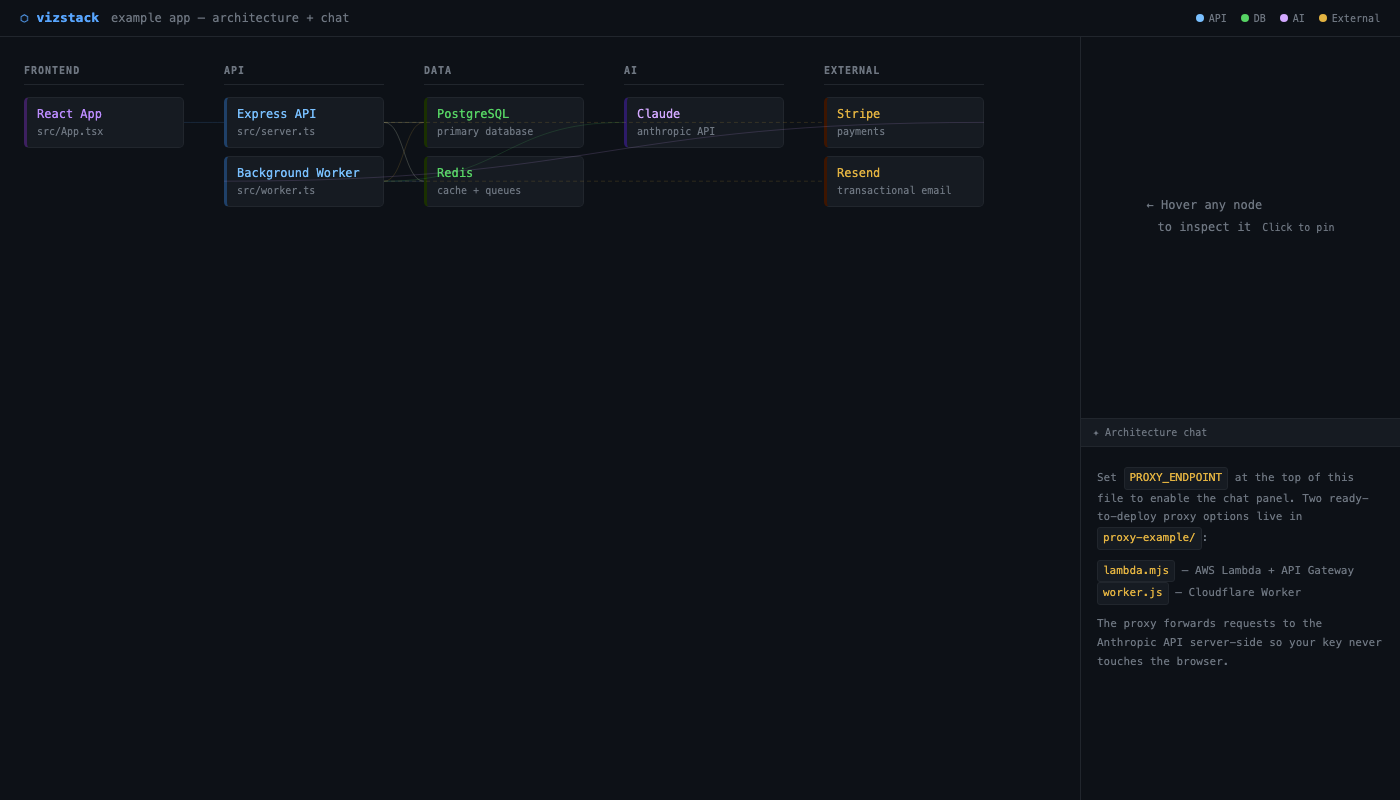
Click-to-pin. Clicking a node locks it — blue ring, edges stay highlighted, panel stays open. Sounds small. Changes how you use the tool.
Architecture-aware chat. When you open the Chat tab, NODE_DATA and EDGES are serialised into a Claude system prompt. Claude receives the full graph before you type anything. Pin a node and its connections inject as focused context on top.
The question that made us build this:
“What breaks first if the crawl pipeline silently fails?”
Claude traced: crawl_jobs → stale briefings → StateIndicatorBar polling forever. That reasoning exists in the code too. The map makes it faster. The chat makes it interactive.
The proxy: AWS Lambda or Cloudflare Worker — both in proxy-example/. Your key, your environment, data never leaves.
The use case we didn’t anticipate
New developer joins. Normally: days of reading route files, schema, figuring out what triggers what, interrupting whoever built it.
VizStack + chat compresses that. Ecosystem map in five minutes. Chat answers what follows. Designers get it too — route tree with badges shows what pages exist and what state they can be in, without needing to know what a loader is.
We’ve started treating the VizStack output as day-one documentation. Not a replacement for reading the code. A structured entry point that gets someone to their first useful contribution faster.
What we’re still figuring out
The proxy setup is where people stop. Three extra steps is three too many for most teams. Hosted option with a usage cap is the next thing.
At 250+ routes the graph gets unwieldy as a system prompt. Selective serialisation — just the pinned node’s neighbourhood — is the direction, not landed yet.
Learnings
- Serialising graph data into a system prompt gives Claude grounded context that general knowledge can’t match.
- Embedding Claude changes the tool’s value category, not just its feature list.
- VizStack started as orientation. It’s becoming onboarding. We didn’t plan that.
- Proxy friction is the adoption killer. Solve that next.
Open source: github.com/jokeane9/vizstack. Proxy options in proxy-example/.